
For B2B sales teams, e-mail analytics is the engine that builds a predictable pipeline. It’s not a report card for your outreach; it's the playbook for understanding what actually drives replies and books meetings, letting your team scale what works without guesswork.
Why Traditional Email Analytics No Longer Cut It
Most sales teams still track email like it’s 2016. They obsess over open rates and click-throughs—metrics that paint a fuzzy, incomplete picture of what’s generating revenue. In a world of skeptical buyers and privacy-first email clients, these vanity metrics have become dangerously misleading.
An SDR might see a 70% open rate and think their campaign is crushing it. But behind the scenes, Apple's Mail Privacy Protection could be artificially inflating that number, while the sequence generates zero qualified meetings. This is the heart of the problem: traditional analytics measure activity, not outcomes. They can’t tell a sales leader why one rep’s sequence converts at 8% while another’s stalls at 1%.
The Disconnect Between Activity and Pipeline
This gap between old-school metrics and real business impact creates massive friction for modern sales organizations. The pain shows up differently across the team:
- For SDRs and BDRs: They pour hours into outreach guided by metrics with no connection to booked meetings. They’re flying blind, with no real idea if their subject lines or value props are hitting the mark.
- For Sales Leaders: They struggle to build a predictable pipeline. When you lack clear insight into which plays convert, coaching becomes subjective and forecasting feels more like astrology than data science.
- For RevOps Teams: They’re stuck stitching together data from fragmented tools—the sales engagement platform, CRM, and data enrichment software. This leads to broken syncs and unreliable reports nobody trusts.
The real cost of outdated e-mail analytics isn't just a bad report. It’s a burned-out sales team, wasted resources on ineffective strategies, and a stalled growth engine.
This manual, fragmented approach isn't sustainable. It forces teams to make high-stakes decisions based on hunches, leading to burned lists and missed targets. To scale, sales teams must shift their focus from surface-level activity to the engagement signals that directly predict revenue.
This requires a new way of thinking about e-mail analytics—one that connects every email sent to a tangible business outcome. The first step is ensuring your emails actually land in the inbox. Learn more in our guide to email deliverability best practices.
The Sales Metrics That Actually Build Pipeline
It's easy to get lost in a sea of data. But focusing on the right numbers is what separates a busy sales team from a high-performing one. For B2B sales, e-mail analytics isn't about vanity metrics; it’s about decoding a prospect's intent and turning that interest into a real sales opportunity.
Think of each metric as a chapter in a story. Learning to read that story is how you build a predictable growth engine. These aren't just abstract data points—they are direct signals telling you exactly what to do next.
This diagram shows how three core metrics—Deliverability, Clicks, and Replies—form the foundation of an effective sales outreach strategy.
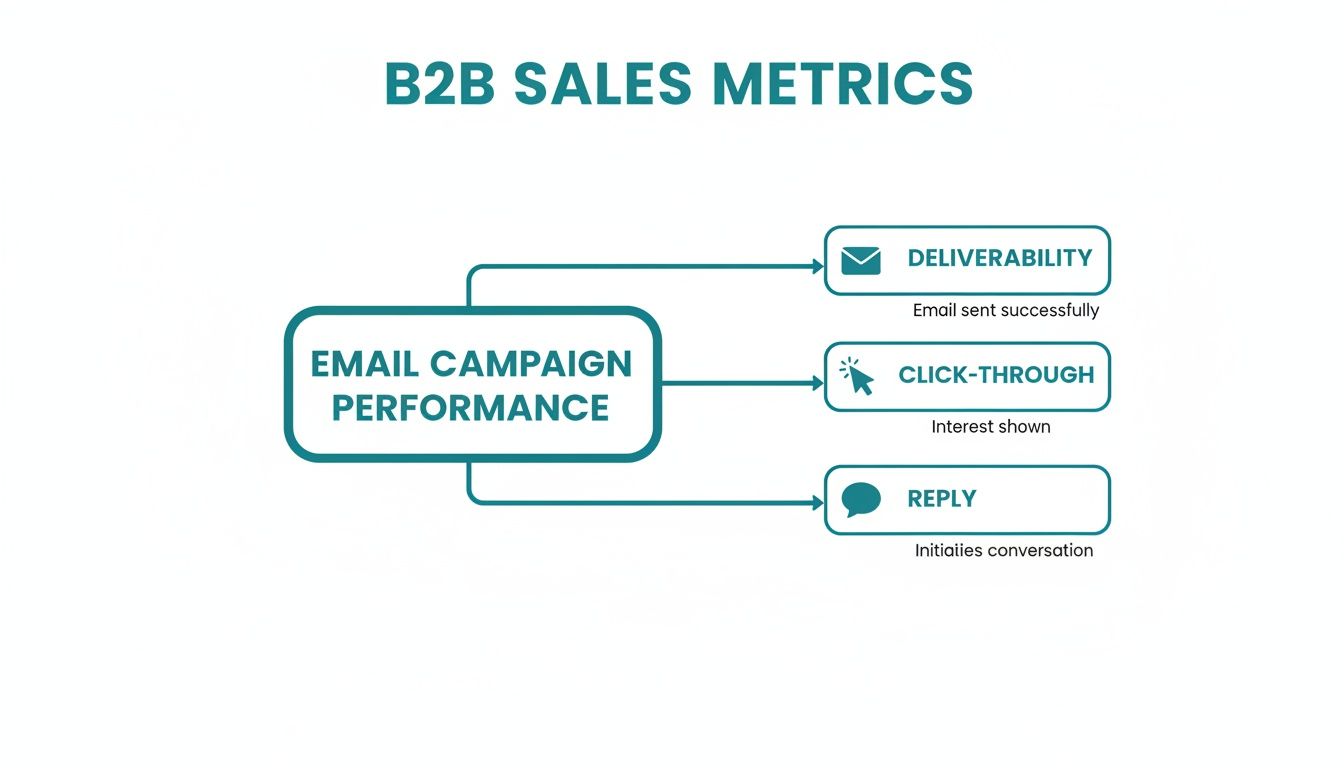
The flow is simple but powerful. Your message has to land in the inbox. Then, it needs to spark enough curiosity for a click. Finally, it has to be compelling enough to start a real conversation with a reply. That's how pipeline is born.
To make this crystal clear, here's a breakdown of the essential metrics and what they mean for your team in the real world.
Key B2B Email Metrics and Their Business Impact
These metrics aren't just for reporting; they are active levers your team can pull to improve performance and drive more revenue. Let's dig deeper into each one.
Deliverability: The Foundation of Outreach
Deliverability isn't just about dodging the spam folder. It’s about protecting your company's most critical outbound asset: your domain authority. A low deliverability rate is a silent killer. Your emails aren't even getting a chance to be read, slowly poisoning your sender reputation until even your most important messages get blocked.
For a sales team, that means dead-on-arrival opportunities. A healthy deliverability rate—anything over 98%—is a sign of a well-oiled machine. It shows your targeting is sharp, your lists are clean, and email providers see your messages as valuable, not spammy.
Bounce Rate: The Canary in the Coal Mine
Your bounce rate is an early warning system that screams "data quality issues!" It's vital to know the difference between the two types:
- Hard Bounces: These are permanent failures, almost always from an invalid email address. If your hard bounce rate climbs above 2-3%, you have a serious problem with your contact data. You're wasting SDR time and actively hurting your domain by emailing ghosts.
- Soft Bounces: These are temporary hiccups, like a full inbox or a server being down. While less severe, a pattern of soft bounces from a specific company could signal a problem with their internal email system.
Click-Through Rate: The True Signal of Intent
In a world where Apple’s Mail Privacy Protection (MPP) makes open rates unreliable, the click-through rate (CTR) has become the go-to metric for measuring genuine engagement. A click isn't an accident. It’s a conscious decision from a prospect who saw enough value in your pitch to want to learn more.
If you see a high CTR but a low reply rate, you've struck diagnostic gold. It means your email's hook is compelling, but your call-to-action is falling flat. This insight allows you to A/B test your CTAs without reworking your entire message.
Reply Rate: The Ultimate Conversion Metric
This is it. This is the number that really matters. A reply—whether it's a "yes," a "not right now," or even a "no, thanks"—is the ultimate proof that your outreach felt human and hit the mark. It confirms you reached the right person with a relevant message at a time they were willing to engage.
For any sales leader, the reply rate is the purest indicator of message-market fit. It cuts through the noise and tells you which sequences and talking points are actually starting conversations. A consistently high reply rate is the bedrock of a predictable pipeline.
Engagement and Lead Scoring
Not all engagement is created equal. A prospect who clicks your case study link, visits your pricing page, and then browses a few product pages is worlds apart from someone who just opened an email. This is where modern e-mail analytics shine, combining these actions into a single engagement score.
This score is a game-changer for prioritizing follow-up. It lets your AEs focus their energy on leads that are showing clear buying signals, instead of chasing low-intent prospects. To go deeper, check out our guide on lead scoring best practices. It’s how you stop reps from wasting time and start accelerating deals with people who are ready to talk.
Building Your Sales Engine for Actionable Insights
Knowing which metrics to track is one thing. Actually doing it is another beast entirely. Raw e-mail analytics are just noise until you have a solid system to capture, sync, and make sense of them. This is where most sales strategies fall apart—buried under a mountain of manual work and fragmented tools that don’t talk to each other.
RevOps teams live this nightmare daily. The sales engagement tool is constantly out of sync with the CRM. The data provider pushes outdated contacts. Attribution feels more like a guessing game than a science. The result? Messy data, reports nobody trusts, and zero confidence in your pipeline forecast. SDRs waste hours manually logging activities, yet leaders still can't get a straight answer on which sequences are booking meetings.

This mess creates a vicious cycle. Bad data leads to bad decisions, which tanks your results, and soon the whole team loses faith in the numbers.
The Problem with a Fragmented Tech Stack
On the surface, a patchwork of specialized tools seems like a great idea. In reality, it creates more problems than it solves. Each tool becomes its own data island, making it nearly impossible to see the complete picture of a prospect's journey.
Here’s what that looks like in practice:
- Broken CRM Syncs: An SDR marks a prospect as "not interested" in their outreach tool, but that status never makes it to the CRM. A month later, another rep reaches out to the same person, making the company look disorganized.
- Messy Attribution: A prospect replies to an email, clicks a link in another, then books a demo through the website a week later. Which touchpoint gets the credit? Sales and marketing start pointing fingers instead of working together.
- Manual Data Entry: Your reps spend a huge chunk of their day copying and pasting notes, activity logs, and contact details from one system to another. It's a time-sink and a recipe for human error.
When your tools don't communicate, your single source of truth becomes a dozen sources of confusion. You can't scale a sales engine on a foundation of broken data and manual workflows.
This is exactly why top-performing go-to-market teams are consolidating their stacks. They're moving away from a Frankenstein's monster of point solutions and adopting all-in-one platforms that handle the entire prospecting workflow from start to finish.
The Advantage of a Unified Platform
An all-in-one prospecting and lead generation platform like Willbe isn't just about having fewer browser tabs open. It’s about building a single, cohesive data engine where every action is automatically captured and analyzed in one place. This creates the clean, reliable data environment that RevOps and sales leaders need to make smart, strategic decisions.
When your sales engagement and CRM are built together, "seamless integration" stops being a marketing buzzword and starts delivering real value.
Here’s what that allows you to do:
- A True Single Source of Truth: Every email sent, link clicked, and reply received is instantly logged in the CRM. No more data gaps. You get a complete, accurate history of every interaction with a contact or account.
- Accurate Meeting Attribution: With a unified system, you know precisely which sequence, message, and rep generated a meeting. This clarity lets you double down on what’s working and coach reps on the plays that convert.
- Reliable Lead and Engagement Scoring: By tracking every touchpoint in one place, you can build a far more accurate engagement score. This ensures your AEs are always focused on prospects showing the strongest buying intent, which speeds up the entire sales cycle.
Ultimately, a unified approach turns your e-mail analytics from a backward-looking report card into a forward-looking strategic asset. It gives your entire GTM team a clear, shared view of performance, so you can finally build a predictable pipeline and scale your success with confidence.
Turning Analytics into Winning Sales Plays
Data is useless until you do something with it. For a B2B sales team, e-mail analytics isn't just a report; it's a playbook showing you what’s working, who to talk to next, and how to coach your team to win. This is where you stop tracking activity and start building repeatable, revenue-generating sales plays.
The concept is simple: every metric should trigger a specific action. Instead of glancing at a dashboard and noting, "Our click-through rate is 3%," a top-tier team asks, "What does this CTR tell us about our message, and how can we use that insight to book more meetings?" This transforms analytics from a passive report card into an active sales weapon.

Playbooks for SDRs and BDRs
For reps on the front lines, email analytics give them immediate feedback to sharpen their outreach. The goal isn't to get it perfect on the first send; it's to iterate quickly based on real data.
- A/B Test Your Subject Lines: This is the fastest way to get more eyes on your message. Pit a benefit-driven subject line ("Cut reporting time by 50%") against a curiosity-driven one ("Question about your GTM stack"). A 2-3% lift in reply rate from a better subject line can mean dozens of new meetings over a quarter.
- Diagnose Where the Message Breaks: Use click and reply rates like a doctor uses symptoms. If a sequence gets a high click-through rate but almost no replies, you've pinpointed the problem: your hook is good, but the call-to-action is too weak or confusing.
- Find Your ICP’s “Golden Hours”: Don't follow generic advice about send times. Look at your own data. You might discover VPs of Engineering at fintech startups are most responsive on Tuesday mornings, while Marketing Directors in healthcare are more active on Thursday afternoons.
Strategies for Account Executives
For AEs, it’s all about prioritization and context. The right data ensures they spend their time on deals that are actually moving, armed with the intelligence to have a smarter conversation.
An AE’s most precious resource is time. Engagement scoring protects it. Instead of treating every lead from an SDR as equal, AEs can look at a prospect's digital body language—multiple email clicks, a pricing page visit, a case study download—to spot accounts that are truly in-market and ready for a conversation. This data-driven focus directly shortens sales cycles.
If your CTR is high but your reply rate is low, your value proposition is compelling but your call-to-action is failing. This isn't a failure; it's a clear, actionable insight telling you exactly what part of your message to fix.
Guidance for Sales Leaders and RevOps
For leadership, email analytics offer the 30,000-foot view needed for smart, strategic decisions. It’s how you scale success, coach effectively, and forecast with confidence.
- Find and Scale Top-Performing Plays: Team-level dashboards will quickly show which sequences, messaging angles, and personas consistently generate pipeline. This lets you codify what’s working and roll it out as the new standard playbook for the whole team.
- Coach with Precision: Stop giving generic advice. A manager can sit down with a rep and say, "I see your Sequence A has a 1% reply rate, while the team average is 6%. Let's break down what top performers are doing differently and adapt it." Coaching becomes a data-informed process, not guesswork.
- Forecast with Confidence: When you know your team's average reply rate and meeting-booked rate per 100 contacts, you can build a predictable pipeline model. Forecasting shifts from a hopeful guess to a mathematical calculation based on leading indicators you can trust.
The Power of Cohort Analysis
The most advanced teams go one step further with cohort analysis. This means comparing how your outreach performs across different segments of your ideal customer profile. For instance, you can analyze how a sequence lands with VPs of Engineering at Series B fintech companies versus Directors of Operations in healthcare.
This precision is no longer optional. In 2026, with over 5.02 billion email users sending 422 billion emails daily, generic outreach is invisible. The numbers don't lie: segmented campaigns can drive 760% higher revenue, and personalized emails boost conversions by 5.5x. As AI-generated emails grow to represent 38% of all traffic, using analytics to tailor your message to specific cohorts is the only way to cut through the noise. You can discover more insights on the future of email engagement and find statistics to guide your strategy.
Designing High-Performance Sales Dashboards
A great dashboard does more than track activity; it tells a story that guides your strategy. For any Sales or RevOps leader, the distinction between a vanity dashboard and a performance dashboard is stark. One shows you how busy your team is; the other reveals how effective they are at generating revenue.
The goal is to build a report that informs critical decisions, not just something to put in a slide deck. This means moving past simple charts of sends and opens to get to the data that gives you a predictive view of your pipeline. When you can draw a straight line from specific outreach efforts to closed deals, you can double down on what works and scale without just hiring more people.

From Vanity Metrics to Performance Indicators
One of the most common traps is building a dashboard that feels good but tells you nothing useful. High open rates and massive send volumes are classic vanity metrics. They look impressive, but they have a notoriously weak connection to actual sales outcomes. A high-performance dashboard, on the other hand, is built on a solid foundation of leading and lagging indicators.
- Leading Indicators: These are your forward-looking metrics. They measure the effectiveness of your team's current activities and help predict future success.
- Lagging Indicators: These are your backward-looking metrics that confirm what happened in the past. They measure concrete outcomes like revenue and sales cycle length.
A balanced dashboard includes both. This gives you a complete, 360-degree view of your sales engine, allowing you to see which activities are driving results today and how they’ll impact revenue next quarter.
The most powerful e-mail analytics dashboards connect the top of the funnel directly to the bottom line. They answer one simple question: "Are our outreach activities creating predictable pipeline?"
Essential Dashboard Components for Sales Leaders
To build a dashboard that drives action, focus on metrics that directly tie outreach to business impact. Ditch the clutter and zero in on the numbers that matter.
Here’s what every modern sales dashboard should have:
- Meetings Booked per 100 Contacts: This crucial efficiency metric tells you how much effort is required to land a qualified meeting, which is invaluable for forecasting team capacity and setting realistic SDR targets.
- Reply Rate by Sequence and Persona: Don't just track your overall reply rate. Break it down to see which messages resonate with your different ICPs. This is how you uncover your most potent messaging and targeting combinations.
- Pipeline Generated from Outbound: This core lagging indicator moves beyond meetings booked to measure the actual dollar value your team’s outreach is creating.
- Conversion Rate (Meeting-to-Opportunity): This metric is all about quality control. A low conversion rate here is a huge red flag, often signaling that SDRs are booking meetings with poorly qualified prospects just to hit a number.
When you can tie prospecting investment directly to these outcomes, justifying that spend becomes simple. In 2026, email marketing is projected to deliver an ROI of $36 for every dollar spent, and the global market is set to explode to $41.83 billion by 2033. This data is vital for any leader proving the value of a modern platform that provides the real-time analytics needed to optimize strategy. You can read the full research about the growing email marketing market to grasp the financial impact.
With a properly designed system, your dashboard becomes so much more than a report—it becomes your command center. Explore a deeper dive into this topic in our article on building effective sales performance metrics dashboards.
The Future of Sales Is Predictive Analytics
The next leap in e-mail analytics isn't about looking in the rearview mirror. We're moving away from simply reporting on what happened last quarter and into a world of proactive, predictive intelligence. The most advanced GTM platforms are now helping sales teams predict what's going to happen next, turning historical data into a powerful forecasting engine.
This means AI can sift through thousands of data points to flag which prospects are most likely to engage. It can suggest the perfect time to send an email and pinpoint which messaging angles will connect with a specific buyer persona. We're shifting from just tracking performance to actively shaping it.
From More Data to Smarter Insights
The future of sales isn't about drowning your team in more spreadsheets. It's about getting smarter, predictive insights that help everyone work with more precision, personalization, and speed—all without sacrificing scale.
This is where a tool like Willbe's proprietary AI shines. It’s not just another generic language model churning out templated copy. It’s an orchestrator designed to sound genuinely human, crafting outreach that makes every prospect feel like you've done your homework on them.
The core advantage of predictive analytics is moving from "what worked" to "what will work." It's about personalizing the next interaction based on real-time signals, not just past performance.
This technology gives your team the ability to:
- Predict Engagement: Identify accounts showing buying signals long before they ever hit "reply."
- Optimize Timing: Send messages automatically at the exact moment a prospect is most likely to be active in their inbox.
- Tailor Messaging: Suggest specific value propositions or pain points that have already proven to convert similar personas.
By turning analytics into a predictive tool, sales teams can finally build a GTM engine that isn't just repeatable—it's constantly self-optimizing. This ensures every touchpoint has the highest possible chance of starting a real conversation and generating more pipeline.
Got Questions? We've Got Answers
Even the sharpest sales teams run into questions when digging into their email data. Let's tackle some of the most common ones we hear about B2B e-mail analytics.
How Is B2B Sales Email Different From B2C Marketing Email?
Think of it this way: B2C marketing is a billboard. It’s designed to catch the attention of thousands of people, hoping a small fraction will stop and look. They’re measuring broad metrics like opens and clicks across huge lists to build general brand awareness.
B2B sales email, on the other hand, is a handwritten letter. It’s personal, targeted, and meant for a specific individual at a high-value account. We’re not just looking for clicks; we’re tracking reply rates to see if we started a real conversation. The goal is to trace a direct line from that email sequence to a booked meeting and, eventually, a closed deal.
What’s a Good Reply Rate for Cold Outreach in 2026?
It depends. But as a general rule of thumb, a solid reply rate for well-targeted cold outreach lands between 5-10%.
That said, the best teams don't just aim for a benchmark. They aim to beat their own last record. With today's AI-driven personalization tools that move beyond simple templates, top performers are often seeing rates well above that range. The real goal is continuous improvement—using your own data to refine your messaging and targeting.
How Can I Stop My Emails From Going to Spam?
Improving your email deliverability is about building a good reputation with email providers. It's not a one-time fix; it's an ongoing practice.
- Start with clean data: A non-negotiable first step. Use a data provider that constantly verifies contact information. This is your best defense against hard bounces, which kill your sender score.
- Warm up your domain: Don't blast out a thousand emails from a new account. Earn trust. Start slow and gradually increase your sending volume over time.
- Personalize everything: Spam filters are smart. They can spot a generic, copy-pasted template from a mile away. Make every email feel like it was written specifically for the person receiving it.
- Practice good list hygiene: Pay attention to your analytics. If someone isn't engaging with your emails after a few attempts, it’s time to remove them from your sequence. A clean list is a healthy list.
Ready to turn confusing email reports into a predictable revenue engine? Willbe brings your entire prospecting workflow into one all-in-one platform. It gives you the unified data and predictive insights to find the right accounts, craft messages that get replies, and scale what works. No more guesswork.