Let’s be clear. A modern sales performance metrics dashboard isn't just another report. It's the command center for your entire go-to-market engine. It’s where you see, in real-time, how prospecting activities connect directly to closed deals, giving you an unfiltered, outcome-driven view of your sales process.
Moving Beyond Dashboards That Only Look Good
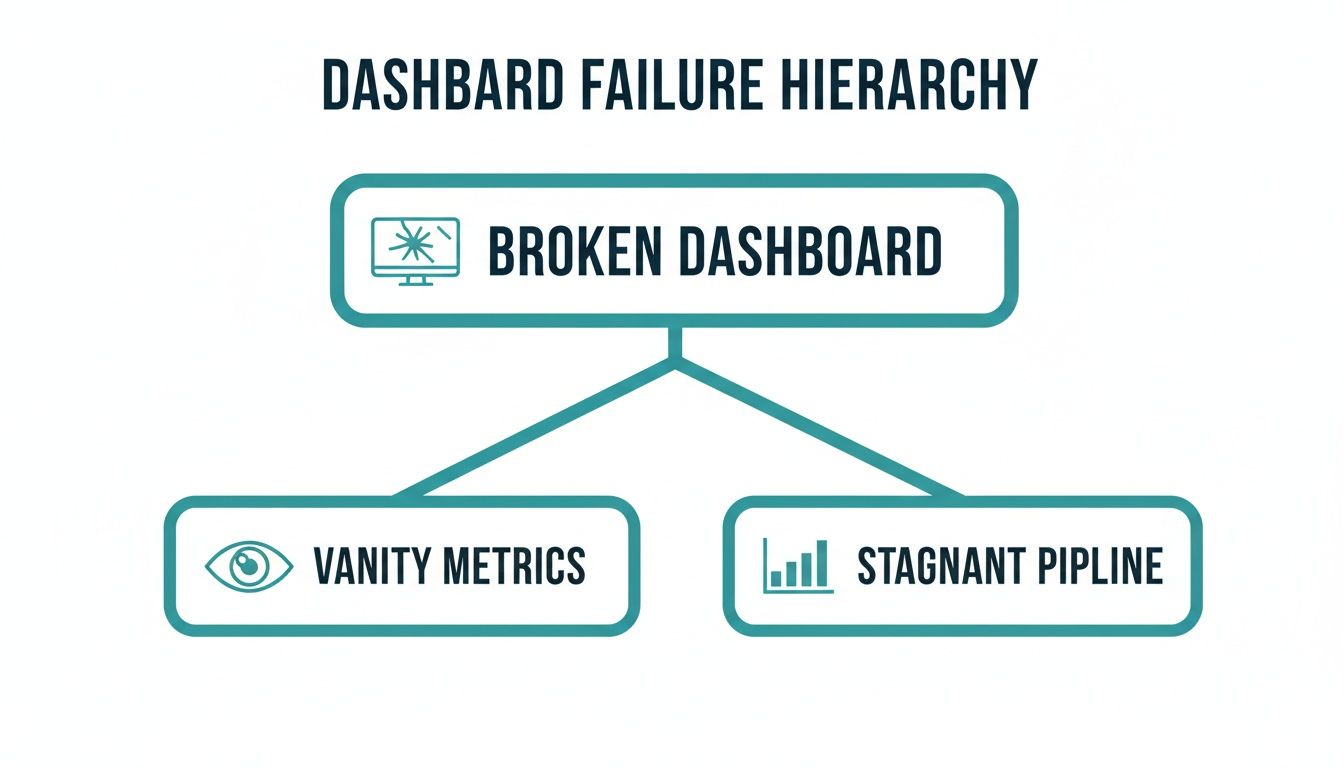
What's the biggest problem sales leaders run into? Dashboards that are all flash and no substance. They're packed with charts that look like you're winning but do nothing to predict actual revenue.
Too many teams fall into the trap of tracking vanity metrics like the number of calls made or emails sent. This creates a dangerous illusion of progress while the pipeline quietly dries up. This isn't a minor annoyance; it's a critical blind spot that costs teams their quarter.
In fact, new research highlights a massive disconnect. Roughly two-thirds of sales leaders admit their dashboards often show metrics suggesting positive momentum that simply doesn't translate into real revenue. If you want to dig deeper, this insightful analysis explains how sales dashboards can be misleading.
This guide is about fixing that. We're going to build a sales dashboard designed for action, not admiration. It's about trading lagging indicators for a predictive tool that genuinely fuels your GTM strategy.
From Vanity Metrics to Revenue Predictability
The old-school approach was all about activity for activity's sake. A rep makes 100 calls, a chart ticks up, and everyone feels productive. But what did those calls actually achieve? How many reached the right person? And how many of those conversations turned into qualified meetings? Without that context, you're just guessing.
A powerful dashboard answers the "so what?" behind every number. It traces the line from an SDR's first email all the way to a closed deal, letting you spot problems long before they have a chance to wreck your quarter.
A great dashboard doesn't just show you what happened last month. It tells you what’s likely to happen next month and gives you the levers to change that outcome. It shifts the conversation from "what was our win rate?" to "what activities are consistently producing our highest win rates?"
Getting there takes more than just a new mindset—it requires the right tech. Instead of juggling fragmented tools that lock data away in silos, teams need a unified platform where activity data is clean, complete, and always in sync.
This is exactly where an all-in-one B2B prospecting and lead generation platform like Willbe comes in. By consolidating everything from initial outreach to a booked meeting, Willbe feeds your dashboard with real-world data, not wishful thinking.
The end goal is a single source of truth that helps everyone on the revenue team—SDRs, AEs, Sales Leaders, and RevOps—make smarter decisions, faster. By the time you finish this guide, you’ll have a clear plan for choosing the right metrics and visualizing your data to build a predictable revenue machine.
Structuring Your Dashboard with Three Metric Tiers
A great sales dashboard tells a story, not just the final score. A flat list of KPIs misses the plot. To truly understand what's happening, you need to structure your metrics into a logical framework that follows your customer's journey.
This tiered approach helps you pinpoint exactly where things are going right—or wrong. Are your SDRs not generating enough qualified meetings at the top of the funnel? Is a promising deal getting stuck in the middle of your sales process? Or is your closing team struggling to get contracts signed? Organizing your metrics gives you the clarity to answer those questions.
Without this structure, dashboards often fail. They either become a collection of vanity metrics that look good but mean nothing, or they hide the real story of a pipeline that's slowly grinding to a halt.
The fix is to think about your sales process in three distinct, interconnected tiers.
Tier 1: Leading Indicators (Top of Funnel)
Think of leading indicators as the inputs for your revenue engine. These are your top-of-funnel prospecting and activity metrics that give you a glimpse into the future. They measure the raw effort and effectiveness of your sales development team.
When these numbers are strong, you can be confident that your pipeline will fill up in the coming weeks and months. But if they start to dip, consider it an early warning. It's a sign that a revenue shortfall is on the horizon if you don't act fast.
Key leading indicators to watch:
- New Qualified Leads: The number of new prospects who fit your Ideal Customer Profile (ICP) and are ready for outreach.
- Meeting-Booked Rate: What percentage of prospects you contact actually agree to a discovery call or demo?
- Positive Reply Rate: The percentage of outreach replies that signal real interest—not just a polite "no, thanks."
- Accounts Touched: How many target accounts have your SDRs actively engaged over a set period?
These metrics are non-negotiable for any sales leader trying to forecast accurately. They answer one simple, crucial question: Are we doing enough of the right things today to win tomorrow?
Tier 2: In-Flight Indicators (Mid-Funnel)
While leading indicators track effort, in-flight indicators measure the health and momentum of the deals already in your pipeline. These are the metrics that show how well your account executives are moving opportunities through the sales cycle.
This is where you spot bottlenecks. A drop in these numbers usually points to a process problem—maybe the SDR-to-AE handoff is fumbled, or discovery calls aren't uncovering enough pain.
In-flight metrics are the heartbeat of your sales process. They reveal the friction points between a booked meeting and a signed contract, allowing you to intervene before a deal stalls out.
Common in-flight indicators include:
- Pipeline Velocity: How fast are deals moving from creation to close? A faster velocity means a more efficient sales cycle.
- Stage Conversion Rates: What percentage of opportunities are successfully advancing from one stage to the next (e.g., Discovery to Demo)?
- Average Deal Size: The average dollar value of all open opportunities in your pipeline.
- Sales Cycle Length: The average number of days it takes to close a deal, from start to finish.
Tier 3: Lagging Indicators (Bottom of Funnel)
Finally, lagging indicators are your results. These are the classic, bottom-line revenue metrics that tell you what has already happened. Your CRO and the board live and die by these numbers. While they don't predict the future, they provide the definitive scorecard on your past performance.
The best sales teams track a healthy mix of metrics from all three tiers. According to research from monday.com, which covers 26 essential sales metrics, the classic win rate remains a vital lagging indicator for showing how effectively a team turns opportunities into actual revenue.
Essential lagging indicators for your dashboard:
- Quota Attainment: What percentage of your sales team is hitting or beating their number?
- Total Revenue Closed: The ultimate measure of success—the total contract value you've closed in a period.
- Customer Acquisition Cost (CAC): The total sales and marketing spend required to bring in a new customer.
To pull it all together, here’s a quick-reference table outlining the core metrics for a well-structured sales dashboard.
Core Metrics for Your Sales Dashboard
A breakdown of essential metrics across the three tiers of sales performance, outlining what each metric measures and why it's critical for revenue leaders.
By organizing your dashboard this way, you move from simply reporting numbers to diagnosing the health of your entire go-to-market motion. You gain the ability to see the connections between top-of-funnel activity and bottom-line results, which is the key to building a predictable revenue machine.
Designing a Dashboard That Tells a Clear Story
Picking the right metrics is only half the battle. If you throw that data onto a screen in a cluttered, confusing mess, you’re creating noise, not clarity. A great sales performance metrics dashboard isn't a data dump; it's a narrative that walks you from the big picture down to the specific details without friction.
The point is to build something so intuitive that anyone—from the CRO down to a brand-new SDR—can glance at it and immediately understand what’s going on. The days of exporting a CSV file just to figure out what happened last quarter are over. The insights need to be right there, on the screen.
This all comes down to designing for the user, focusing on clarity over cramming in as much data as possible. Simple elements like a consistent color scheme and a clean layout make a world of difference.
Create a Clear Visual Hierarchy
The best dashboards are structured like a pyramid. At the top, you have the most important, big-picture numbers that leadership needs to see. As you scroll down, the data gets more specific, letting managers and reps dig into the "why" behind those numbers.
This tiered structure allows users to naturally drill down and find the root cause of a problem instead of getting lost in a sea of charts.
Executive View (Top Level): This is the 30,000-foot view. It should feature just 2-4 of your most critical outcome metrics, like Total Pipeline Value, Quota Attainment, and Win Rate. The goal is to answer one question instantly: "Are we on track to hit our number?"
Team View (Mid-Level): Here, sales leaders can see how their teams are performing. This section breaks down metrics like Meeting-Booked Rate and Stage Conversion Rates by team or region. It helps answer, "Which teams are performing, and which ones need more support?"
Individual View (Bottom Level): This is where managers and reps can zoom in on individual performance. You’ll track metrics like Activities per Rep, Positive Reply Rates, and Individual Pipeline Velocity to make coaching conversations specific and data-driven.
By layering the information this way, you prevent people from getting overwhelmed and ensure everyone sees what’s most relevant to their role first.
Choosing the Right Chart for the Job
The type of chart you use to display data dramatically affects how quickly someone can understand it. The wrong visualization can easily hide important trends or make simple data look confusing. Think of each chart as a specific tool for telling a part of the story.
A well-chosen chart doesn't just show you numbers; it gives you context. A rising line chart is universally understood as growth, while a narrowing funnel immediately screams "bottleneck!"
Here’s a quick rundown of which chart to use and when:
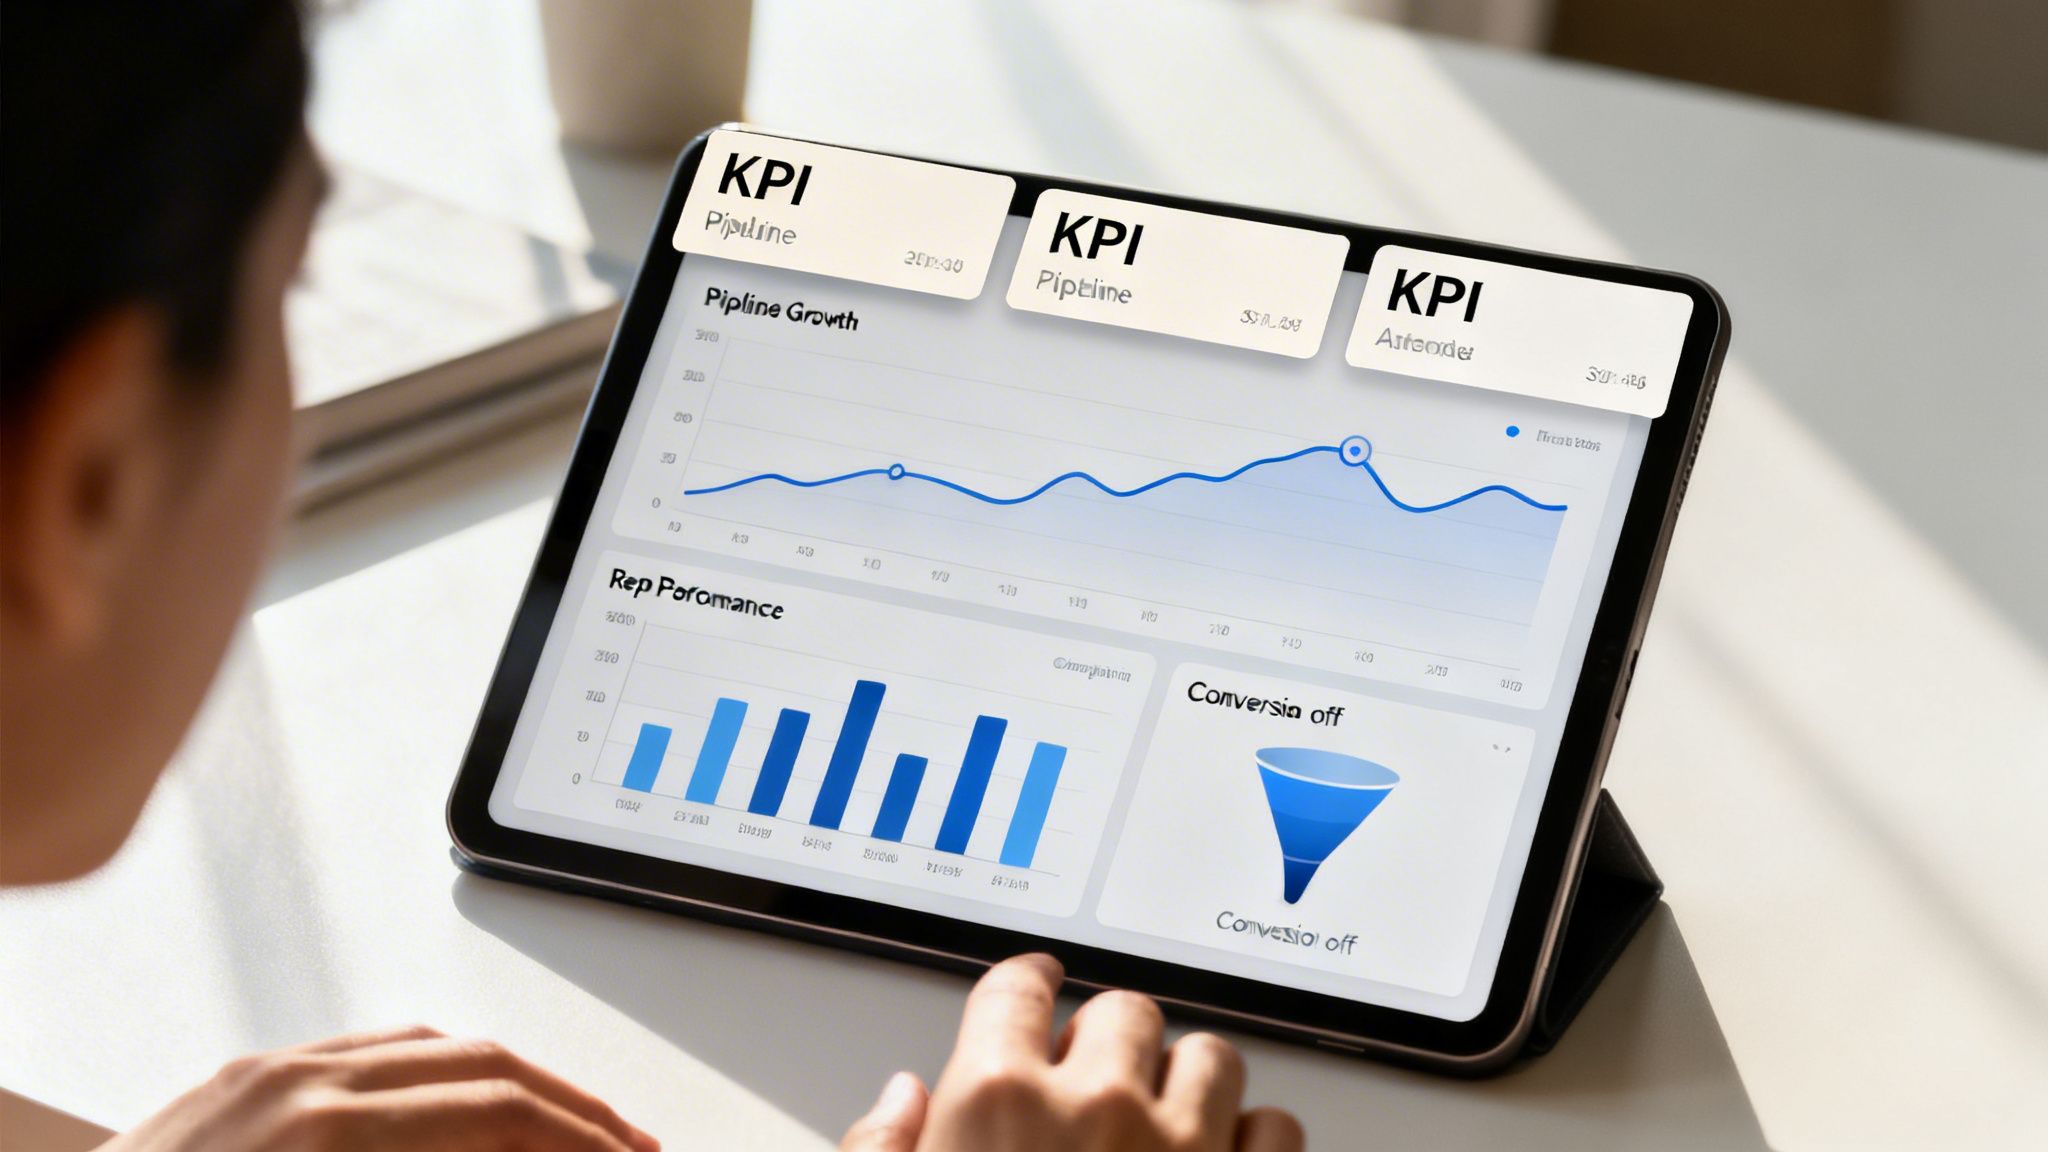
Line Charts: Your go-to for showing performance over time. Use them to track trends in things like Pipeline Growth, Revenue Closed per Month, or New Qualified Leads Generated over the course of a quarter.
Bar Charts: Nothing beats a bar chart for direct comparison. They’re perfect for stacking Quota Attainment across different AEs, comparing Meetings Booked for each SDR, or seeing which product line has the highest Win Rate.
Funnel Charts: Essential for analyzing your sales process. Funnel charts show you the conversion rates from one stage to the next, making it incredibly easy to spot where deals are getting stuck and falling out of the pipeline.
Gauges and Scorecards: For your most critical, single-value KPIs like Total Revenue or Year-to-Date Quota Attainment, gauges and big-number scorecards give you an immediate "are we winning or losing?" status check against a set goal.
When you deliberately choose your visualizations, you're not just building a dashboard; you're crafting a narrative that turns raw data into a clear, compelling story that inspires action. This is the core of building a sales performance dashboard that your team will actually use.
Creating a Single Source of Truth for Your Data
Your sales performance dashboard is only as reliable as the data feeding it. If that information is scattered across different tools, incomplete, or wrong, you're building your entire strategy on a foundation of sand. This is how you end up with inaccurate forecasts, coaching sessions that miss the mark, and targets that feel impossible to hit—the exact issues a good dashboard is supposed to fix.
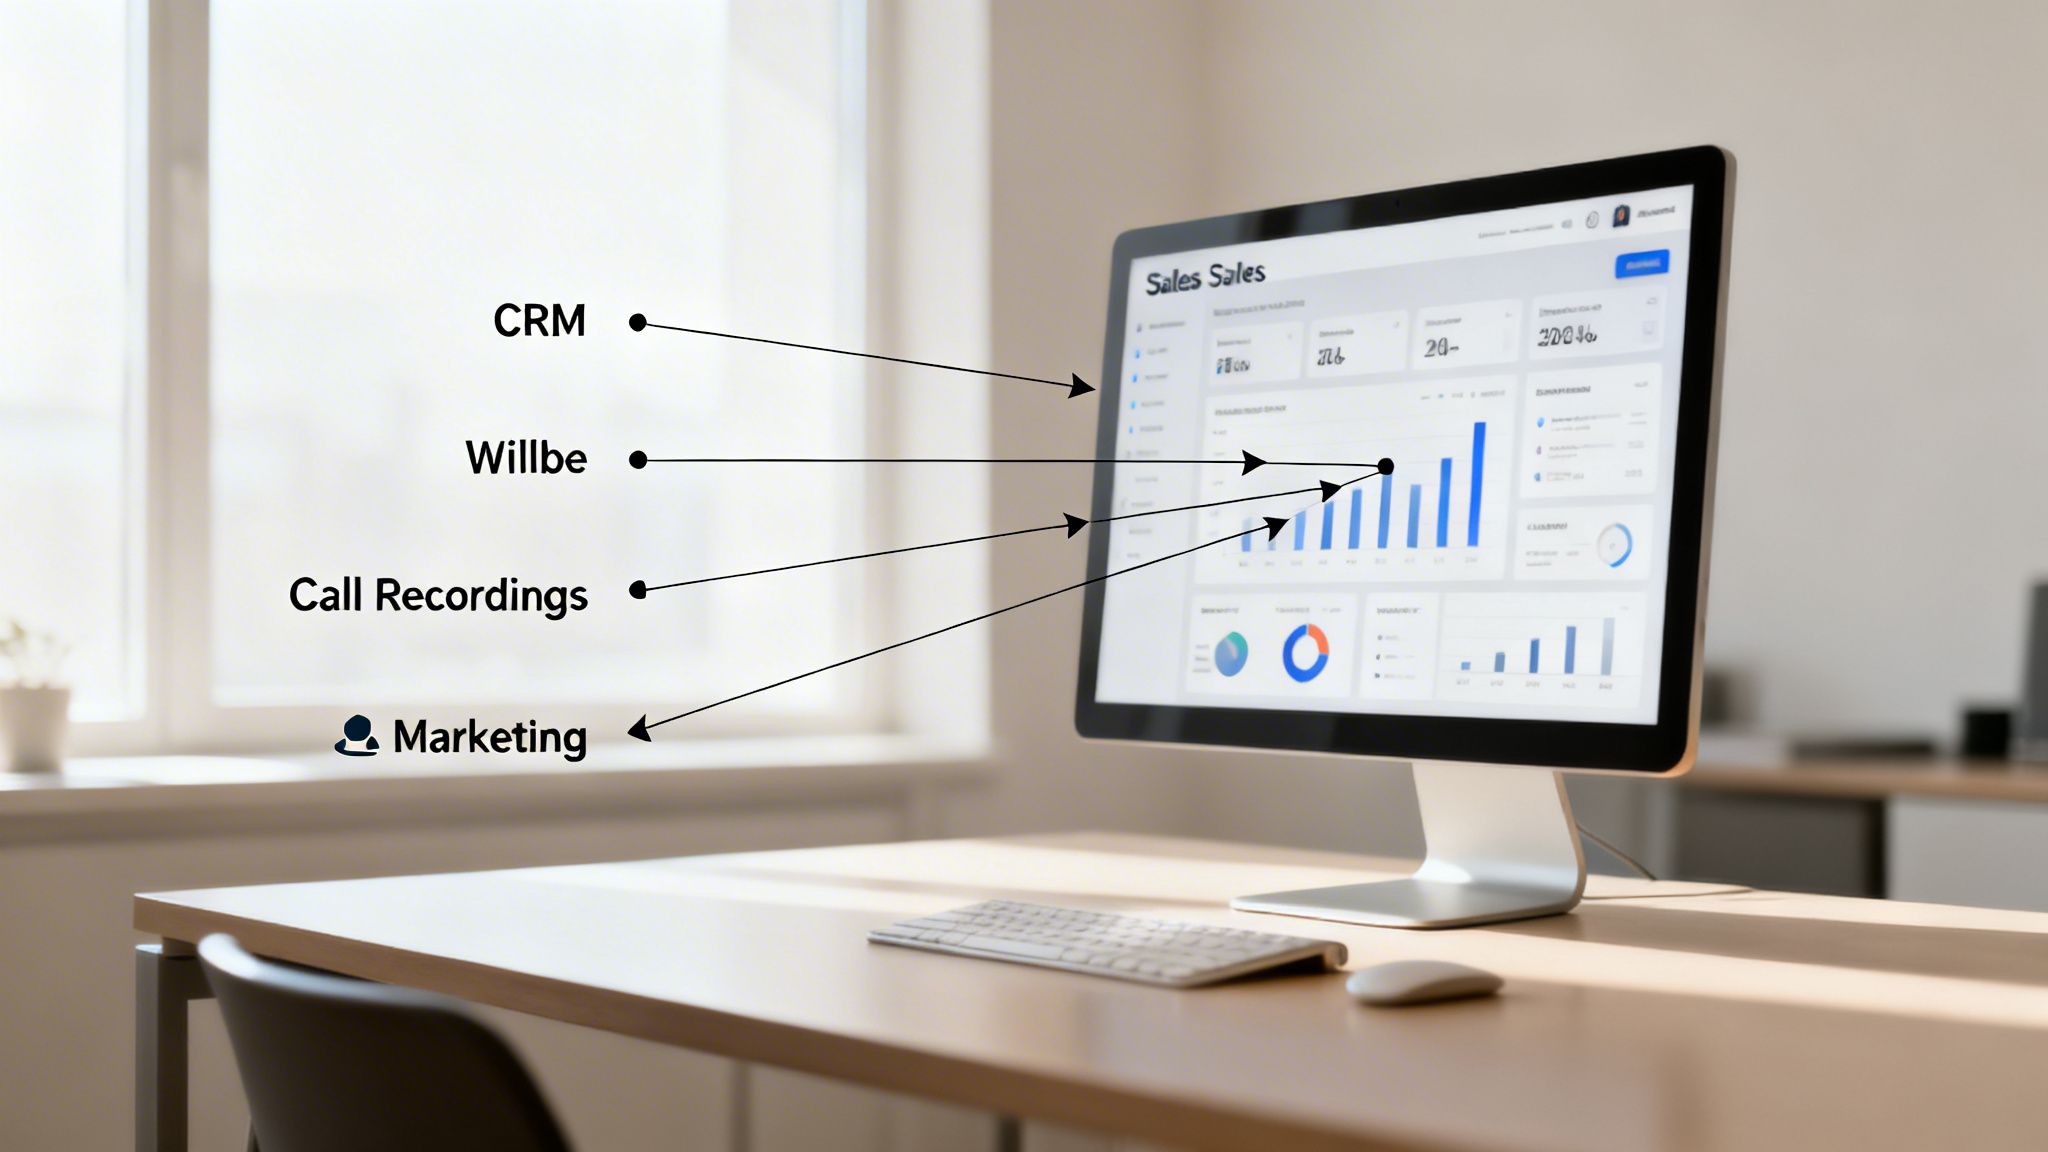
The biggest culprit is data fragmentation. Your CRM is the heart of your sales operation, but it rarely shows the full picture by itself. It’s great at tracking deal stages and closed-won revenue, but it often misses the critical top-of-funnel context that explains how those deals were created.
This is why establishing a single source of truth isn't just a "nice-to-have." It's about pulling together all the disparate pieces to create a complete, panoramic view of your entire revenue engine.
Unifying Your Sales Data Stack
To build a dashboard you can trust, you need to pull in data from all the key tools your team uses every day. This is how you move from a collection of isolated data points to a cohesive story that clearly links specific activities to real-world outcomes.
Sales Engagement Platforms: This is ground zero for your top-of-funnel activity. Data on email open rates, positive replies, and meeting-booked rates from your outreach sequences are the best leading indicators you have for future pipeline.
Call Recording Software: Tools like Gong or Chorus provide a treasure trove of qualitative data. When you integrate call analytics, you can start correlating specific talk tracks or objection-handling techniques with actual win rates, adding a rich layer of "why" to your performance metrics.
Marketing Automation Systems: Platforms like HubSpot or Marketo are fantastic for tracking lead sources and campaign attribution. Connecting this data finally helps you answer the age-old question: which marketing channels are actually driving the leads that turn into revenue?
Without these integrations, you’re just guessing. A sales leader might see a rep’s pipeline looking thin but will have no way of knowing if the root cause is poor outreach, a clumsy handoff from marketing, or something else entirely. Unifying the data removes the guesswork.
A single source of truth gets you out of the world of "I think" or "I feel." Suddenly, every decision—from a manager's 1:1 coaching plan to a CRO's board presentation—is backed by solid, reliable data that connects every single touchpoint in the buyer's journey.
How Willbe Creates Data Integrity
This is exactly the problem Willbe was designed to solve. When you have a messy collection of prospecting tools, you create data silos by default. If your SDRs are using one tool for contact data, another for sequencing, and then manually logging activities in the CRM, information is bound to get lost, duplicated, or entered incorrectly. Your dashboard is compromised before you even start.
Willbe’s all-in-one platform cuts through that chaos. By bringing all prospecting activities—from finding verified contacts to running multi-channel outreach—into a single system, it ensures every piece of data is clean, consistent, and accounted for. For a deeper look at this, check out our guide on sales pipeline management best practices.
Since every action is captured natively within the platform, the data that syncs to your CRM is complete and accurate by default. This automatic, two-way sync means your dashboard reflects what's actually happening in real-time. You can finally trust the numbers because you know exactly where they came from: a unified system built for data integrity.
Turning Your Dashboard Insights into Action
A great dashboard is more than just a report card on past performance. It’s your command center, showing you exactly what to do next. When your sales performance metrics dashboard shifts from a passive reporting tool to an active diagnostic engine, you create a culture where everyone on the revenue team can make smarter, faster decisions.
This is where data connects directly to day-to-day execution. The goal is to get beyond knowing the numbers and start understanding the stories behind them. It changes the entire conversation from "What happened?" to "What should we do next?"
The real impact comes when every person can use the dashboard to self-diagnose and tweak their approach. SDRs see which messages land, AEs pinpoint where deals get stuck, and leaders deliver coaching that’s precise, timely, and backed by undeniable data.
Actionable Playbooks for Sales Leaders
A sales leader’s job is to remove roadblocks and replicate success. An action-oriented dashboard provides the real-time visibility to do just that, turning gut-feel management into a data-driven science.
Imagine a sales manager notices a top-performing SDR’s meeting-booked rate has suddenly dropped by 15% week-over-week. Instead of a generic "What's going on?" conversation, they can click into the dashboard to see the underlying activity.
- The Diagnosis: They quickly find the rep’s positive reply rate on a new email sequence is near zero.
- The Action: The leader can immediately flag the failing sequence, review the copy with the rep, and workshop new messaging based on what the data shows is working for others on the team.
This approach swaps vague feedback for hyper-specific coaching. The dashboard becomes a powerful tool for proactive sales enablement, a topic we dive into deeper in our guide on sales enablement best practices.
Empowering RevOps to Optimize the Engine
For Revenue Operations, the dashboard is the primary tool for finding and fixing friction in the entire go-to-market machine. RevOps isn't just looking at individual performance; they’re monitoring the health of the whole sales process.
Let's say overall pipeline velocity slows down, putting the quarterly forecast at risk. A RevOps leader can use the dashboard to analyze stage-by-stage conversion rates.
The dashboard reveals that deals are consistently getting stuck at the "Technical Validation" stage. The conversion rate from there to "Proposal" has plummeted from 60% to 35% in the last month. This isn't a rep problem; it's a process bottleneck.
Armed with this insight, RevOps can take immediate, targeted action:
- Investigate the Cause: They can interview AEs to find out what's causing the logjam. Is the sales engineering team swamped? Is the demo environment buggy?
- Implement a Solution: Maybe they need to create new battle cards for handling technical objections or schedule a training session with the product team.
- Measure the Impact: After rolling out the fix, they use the dashboard to watch that specific conversion rate, making sure it climbs back to a healthy level.
Enabling Reps to Self-Coach and Win
An effective sales dashboard also empowers individual contributors—your SDRs and AEs—to take ownership of their performance. When reps have clear visibility into their own metrics, they can spot problems and adjust their strategy without waiting for their weekly 1:1.
For an SDR, this could mean seeing that one of their outreach templates is generating a much higher positive reply rate than the others. They can immediately double down on what works and ditch what doesn’t, effectively optimizing their own playbook in real time.
For an AE, it might be noticing their average sales cycle length is creeping up past the team average. By looking at their personal stage conversion rates, they might realize they're spending too long in discovery and not qualifying deals out quickly enough. This kind of self-realization is often far more powerful than any top-down feedback.
When your dashboard is built for action, it stops being a tool for inspection and becomes a catalyst for improvement at every single level of the organization.
Fueling Your Dashboard with Willbe's Granular Data
A good sales performance dashboard tells you what happened. It shows you that pipeline grew, win rates dipped, or that sales cycles got shorter. But the best dashboards, the ones powered by truly meaningful data, tell you why. While your CRM is great at tracking deal stages, it's often completely blind to the prospecting activities that actually create those deals.
This is where the real story lives. The metrics that give you the most context—things like which email templates get positive replies or which buyer personas book the most meetings—are usually stuck in a fragmented mess of different prospecting tools. Without that data, your dashboard is just a high-level summary, not a strategic tool.
By bringing all those disconnected prospecting activities into one clean system, Willbe creates a single source of truth. This reliable, accurate data can then feed directly into your main dashboard, enriching it with the context you need to make smart, strategic decisions instead of just reporting on the past.
Connecting Activity to Outcomes
Willbe doesn't just see that a meeting was booked. It sees the entire sequence of events that led to that booking. This means you can sync incredibly specific, outcome-focused metrics into your dashboard and finally move beyond counting dials and emails.
Think about what your dashboard could show you. Instead of just "meetings booked," you could see:
- Meeting Conversion Rate by Sequence: Instantly spot which outreach campaigns are turning cold contacts into qualified meetings.
- Positive Reply Rate by Persona: Pinpoint which job titles and industries are responding best to your messaging, so you can double down on your ideal customer profile.
- Performance by Message Type: Finally get a clear answer on whether AI-personalized emails are outperforming your standard templates or if LinkedIn messages are driving more conversations.
With this level of detail, your dashboard transforms from a simple report card into a living go-to-market playbook. Sales leaders can see exactly which strategies are working and put more resources behind them, while cutting the efforts that are just wasting time.
When your dashboard is fueled by real-time outreach performance data, you stop guessing what works. You know. And that clarity is the key to building a predictable and scalable sales engine.
Building a Predictive Analytics Layer
The real impact comes when you use this integration to build a predictive layer on top of your sales dashboard. Because Willbe’s all-in-one platform captures every touchpoint—from the first email to the meeting handoff—you can start drawing direct lines between your team's daily activities and your revenue goals.
To see exactly how this works, you can explore Willbe's approach to sales analytics and learn how it delivers this unmatched visibility.
Willbe’s data helps you answer the questions that truly drive predictable growth:
- Which outreach channels bring in leads with the shortest sales cycles?
- Do prospects who engage with AI-personalized messages end up having a higher lifetime value?
- How many positive replies do we need to generate this week to hit our pipeline target for next month?
By syncing this granular data, Willbe turns your dashboard from a rearview mirror into a forward-looking command center. It gives you the power to not just report on what happened last quarter, but to actively shape the results of the next one.
Frequently Asked Questions
Got questions about building and using a sales performance dashboard? We've got answers.
What's the Difference Between Leading and Lagging Indicators?
Think of it this way: lagging indicators tell you what happened, while leading indicators predict what's going to happen.
Lagging indicators are your results—the final score. Metrics like closed revenue and quota attainment are perfect examples. They’re crucial for measuring past performance, but by the time you see them, it's too late to change the outcome.
Leading indicators, on the other hand, are the activities that drive those results. Things like new meetings booked or positive reply rates are all about the inputs. A healthy pipeline is built on strong leading indicators, and tracking them on your sales performance metrics dashboard is how you know if you're on track for the future. You need both to get the full picture.
How Often Should I Update My Sales Performance Dashboard?
In sales, things move fast. Your dashboard needs to keep up. Aim for real-time updates, but at the absolute minimum, it should refresh daily.
Waiting a week for new data is like driving while looking in the rearview mirror. You end up reacting to problems that happened last week instead of proactively coaching your team to prevent issues that could tank this quarter's forecast.
When you have live data, you can spot a problem—like a new outreach sequence that's falling flat or a big deal that has stalled out—and jump on it immediately, before it derails your goals.
What Are the Best Tools for Building a Sales Dashboard?
Most sales teams start using the built-in dashboards that come with their CRM, like the ones you find in Salesforce or HubSpot. When you need to pull in data from multiple sources or create more advanced visualizations, dedicated BI tools like Tableau or Looker are the next step.
But here’s the key: a dashboard is only as good as the data feeding it. If your data is fragmented or incomplete, your dashboard will be, too. This is why having an all-in-one platform is so important. It ensures the granular activity data—the who, what, and when of every interaction—is clean and reliable. That context turns a simple report into a strategic command center.
A powerful dashboard is built on a single source of truth. Willbe brings your entire prospecting workflow into one place, ensuring the data you use to make decisions is always clean, accurate, and ready for action. See how Willbe fuels predictive sales analytics.